Diameter analysis
Diameter analysis estimates vessel diameter from line scan kymographs.
Before you start
- Load a line scan kymograph.
- Select or create an ROI covering the vessel region to analyze.
See Using the GUI for loading files and ROIs.
Run diameter analysis in the GUI
- Select the file, channel, and ROI in the file list.
- Open the left navigation toolbar and click Diameter (straighten icon).
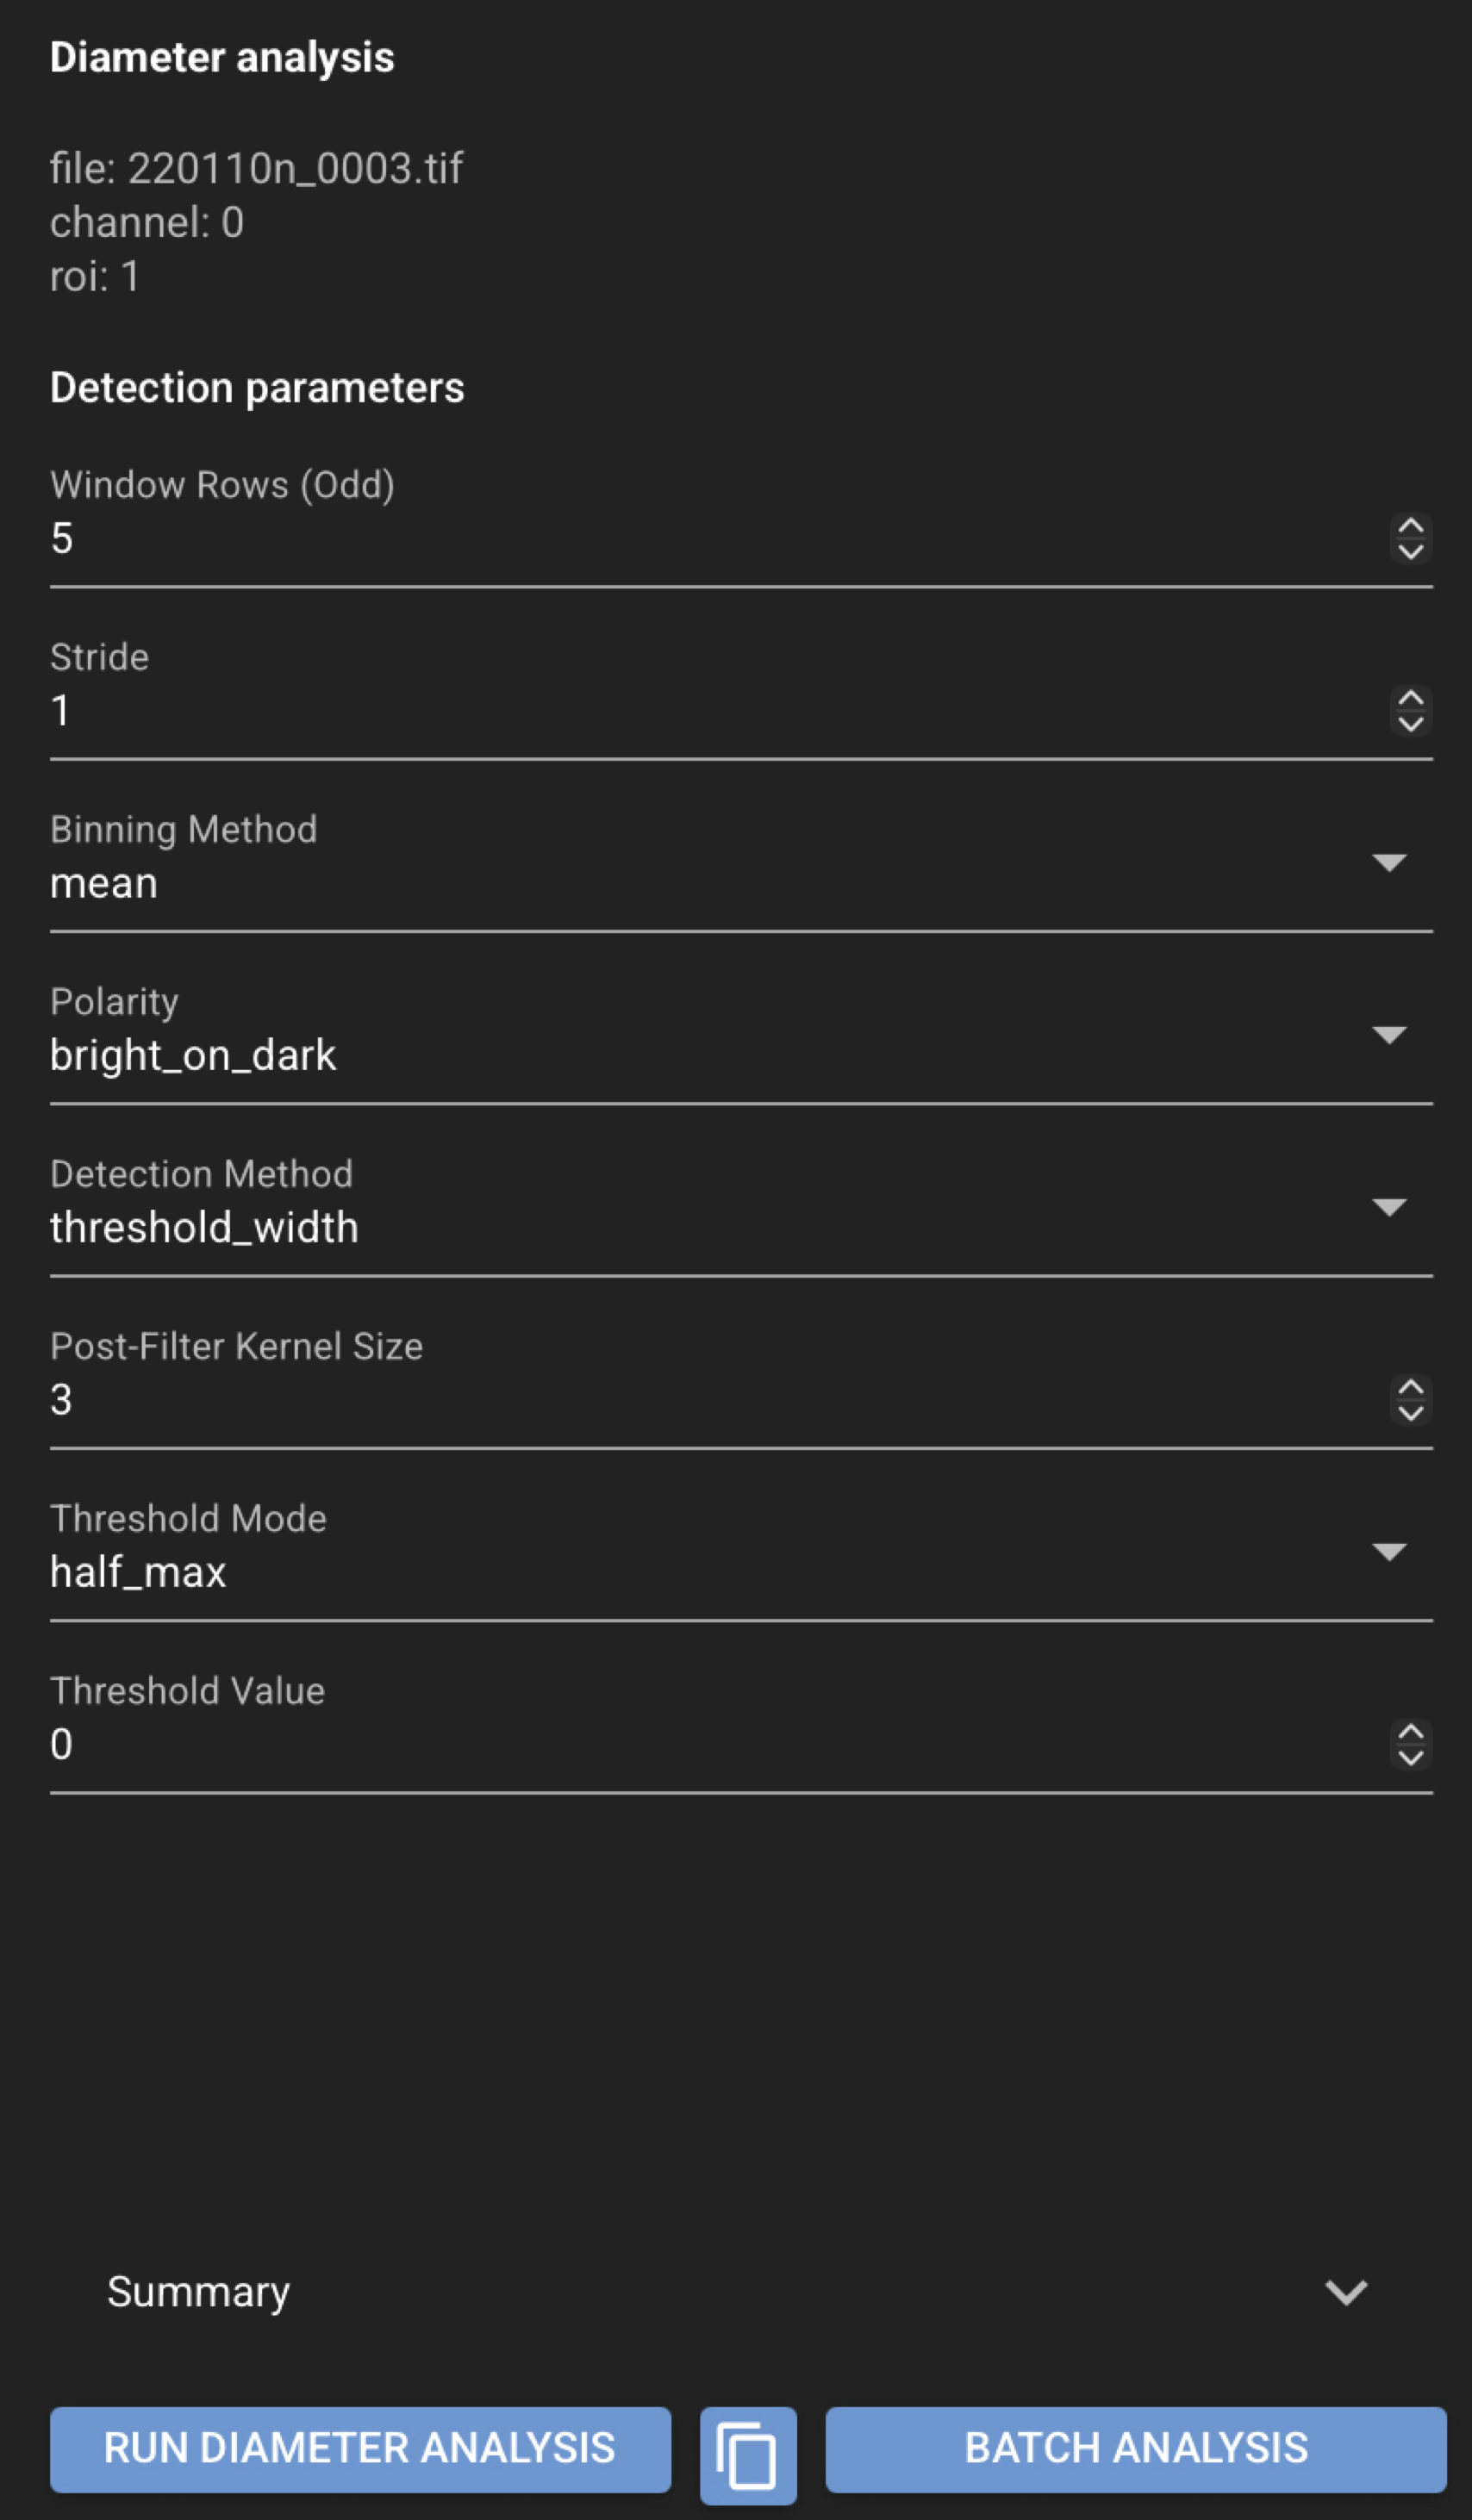
- Review Detection parameters in the Diameter panel.
- Run the analysis.
- Review the summary, quality-control values, and tabular output.
- Use Save Selected or Save All near the top of the window to persist results.
Results and reproducibility
Review diameter results in the Diameter panel and the Analysis plot. Use Save Selected or Save All to write JSON and CSV files next to the source image. See Saved file formats for output file details.
Saved files
For a source file named my_file.tif:
my_file.tif.json
my_file.tif.diameter.csv
The JSON file stores detection parameters and summary values (for example mean diameter and QC scores). The CSV stores tabular diameter results.
See also
Detection parameters and science detail live in AcqStore diameter analysis and the diameter analysis notebook.