Pool plots
Pool plots give you a folder-wide view of analysis results on the CloudScope Home page. While the main viewer focuses on one file at a time, the pool panel aggregates rows from every loaded acquisition in the current folder — in vivo velocity summaries on the Velocity tab and peak-detection events on the Peaks tab. You can filter, group, and chart those rows with scatter, swarm, histogram, and other plot types to compare conditions (for example genotype or treatment) without opening each file separately. The pool updates in real time as you load or remove files, run or change analyses, edit ROIs, or update experiment metadata, so the chart always reflects the folder you have open.
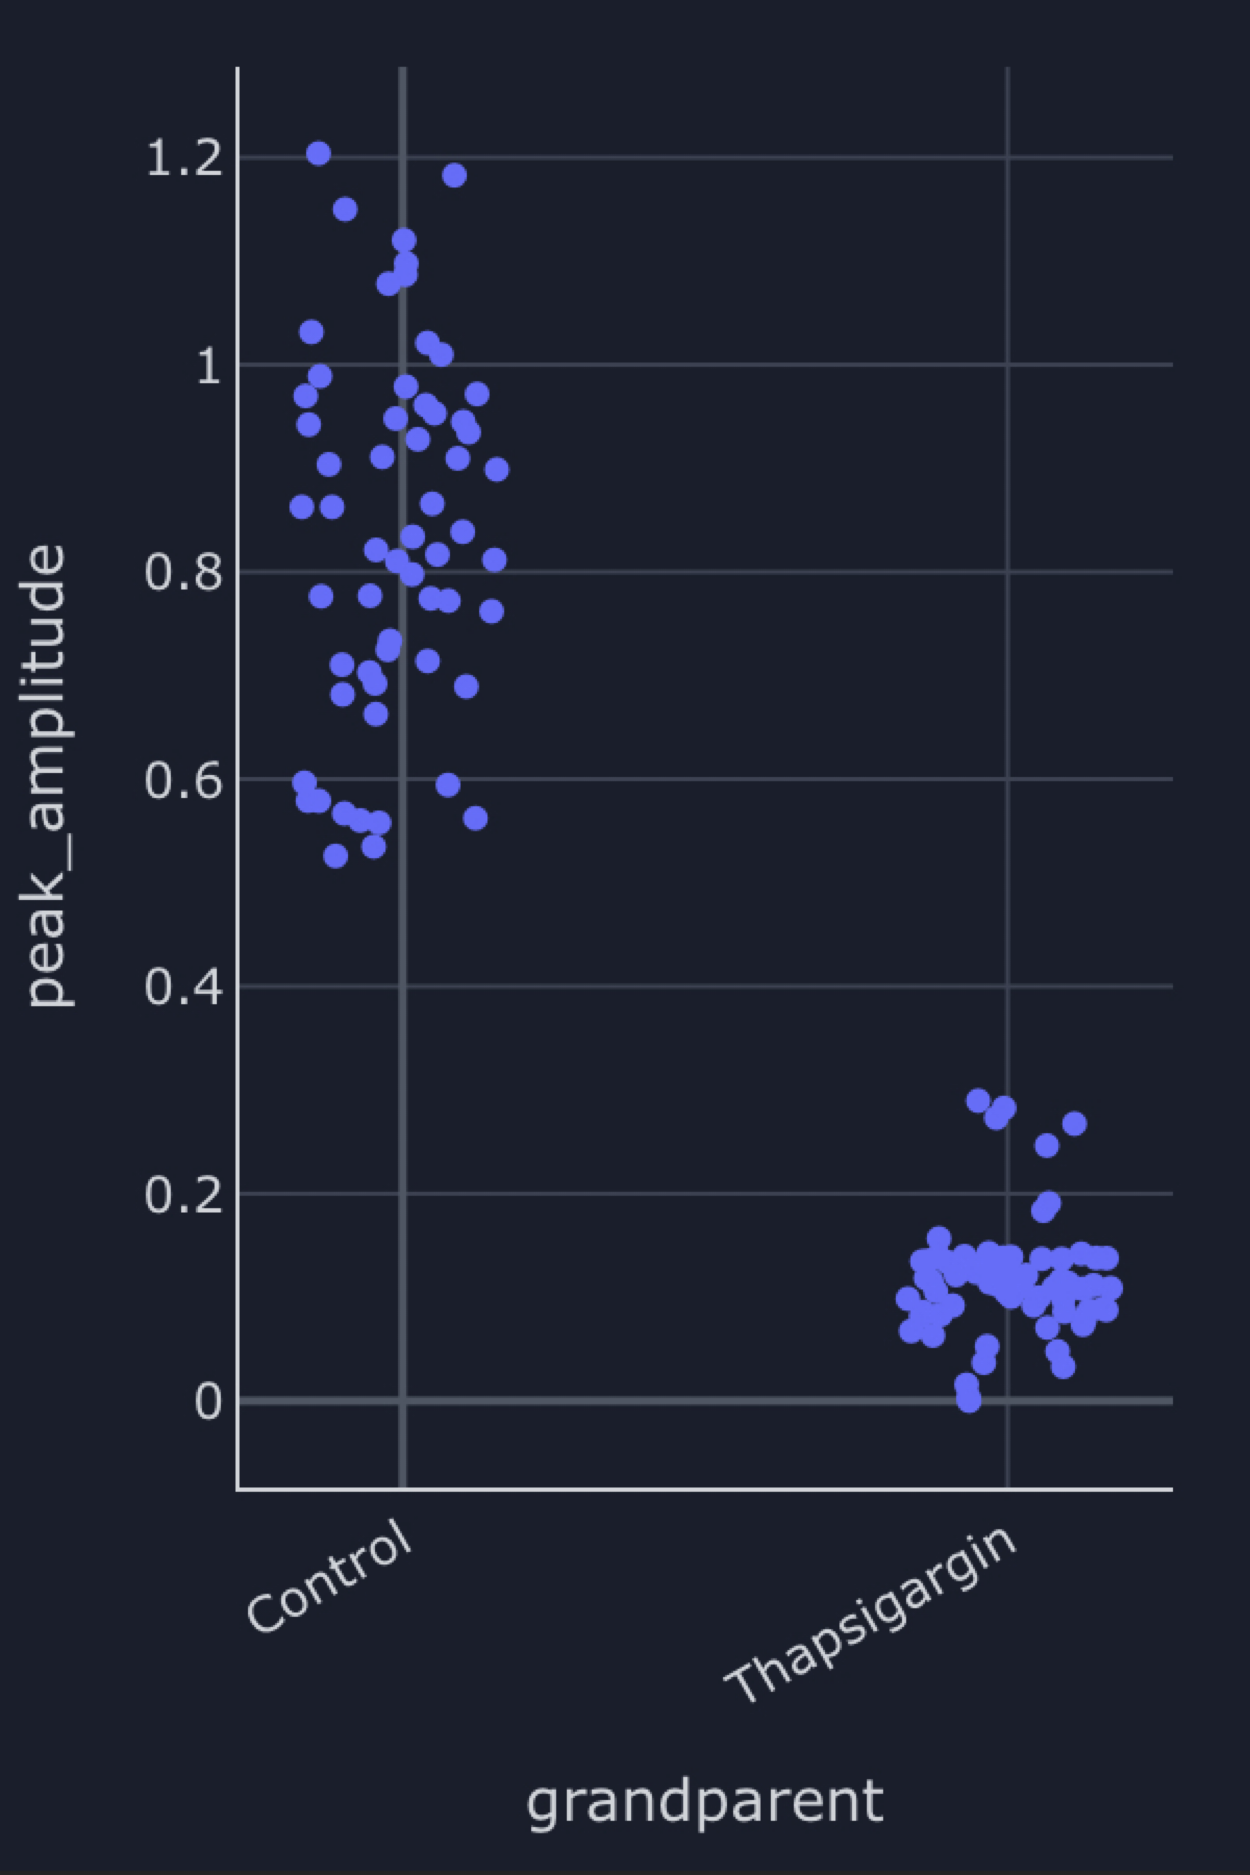
The example above is a swarm plot of peak_amplitude from the Peaks pool, with points grouped by Genotype. Each dot is one detected peak event from peak detection across the loaded folder; swarm spacing separates overlapping values within each genotype group.
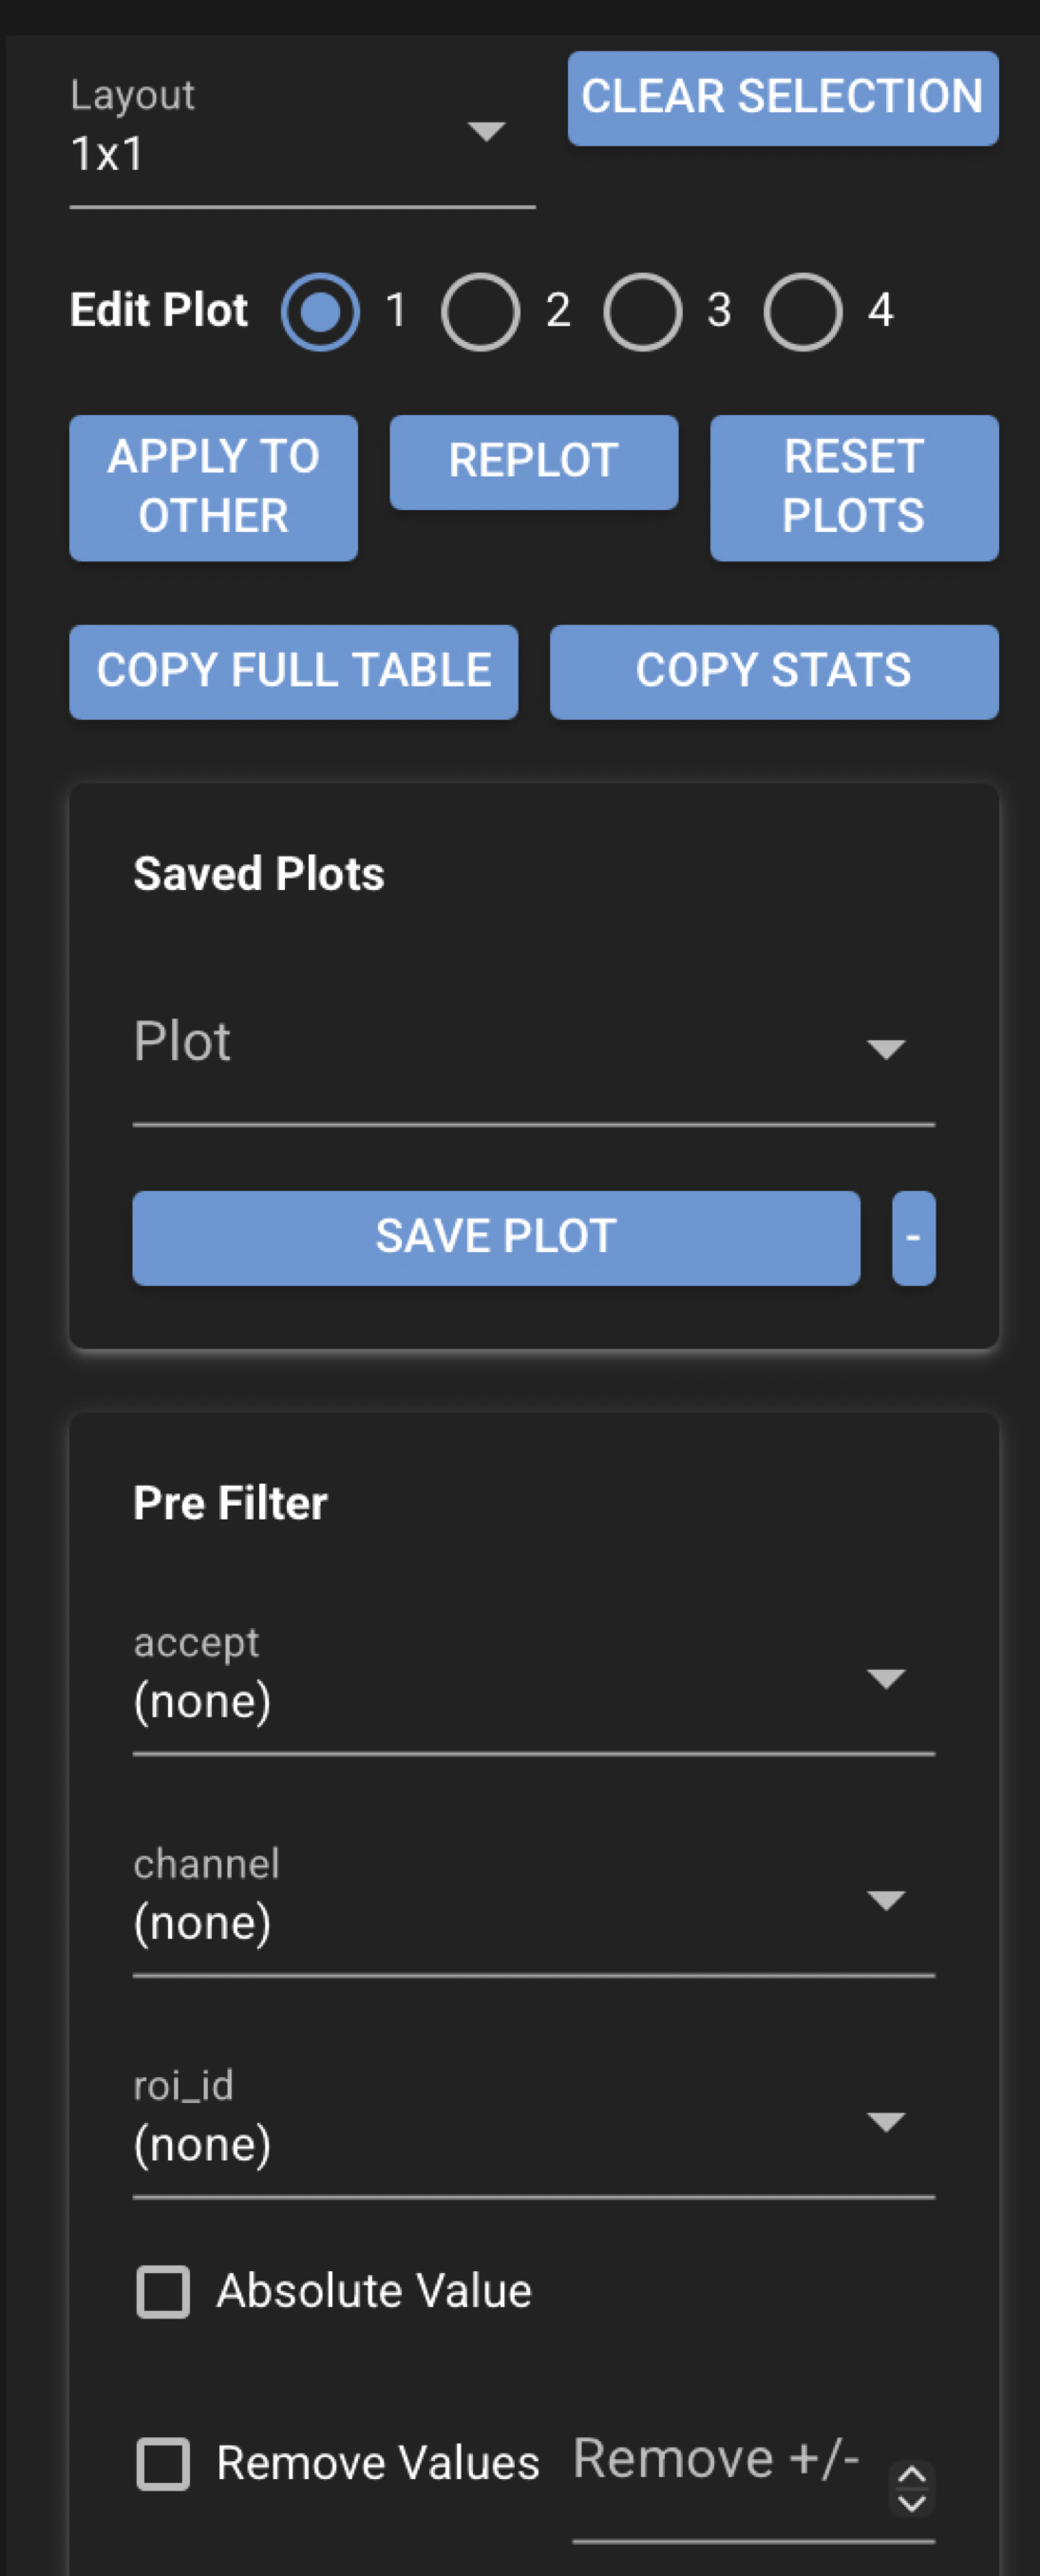
Click a point in the pool plot to select the corresponding row in the pool table and sync selection back to the main GUI (file list and primary views). Use Copy full table to copy the entire pool for the active tab to the clipboard as tab-separated text — every row and column currently in the pool, suitable for paste into a spreadsheet. Use Copy stats to copy an organized summary of precisely what the current plot is showing (grouping, counts, and statistics for the displayed values). Replot first if Copy stats reports that no summary is available yet.
Documentation coming soon
This page is a first-pass overview. Detailed documentation for every pool-plot control, preset, and plot type will be added in a future update.
Open pool plots
On the CloudScope Home page, click Pool Plots in the top header to open or close the pool panel on the right side of the window. The main image viewer and analysis plots stay on the left; pool plots occupy the right splitter.
Desktop multi-window builds can also open a standalone pool window from the header Open Pool control when that option is available.
Velocity and Peaks tabs
The pool panel has two tabs:
| Tab | Data source |
|---|---|
| Velocity | One row per analyzed velocity result in the loaded folder (Radon velocity summaries and related columns). |
| Peaks | One row per detected peak event from peak detection in the loaded folder. |
Switch tabs to change which analysis pool you are exploring. Each tab has its own plot layout, filters, and export actions.
Live folder-wide updates
Pool tables stay synchronized with the loaded folder. When you load or remove files, run or change analyses, edit ROIs, or update experiment metadata, the corresponding pool rows refresh automatically. You do not need to reopen the panel to pick up new results after batch or single-file work.
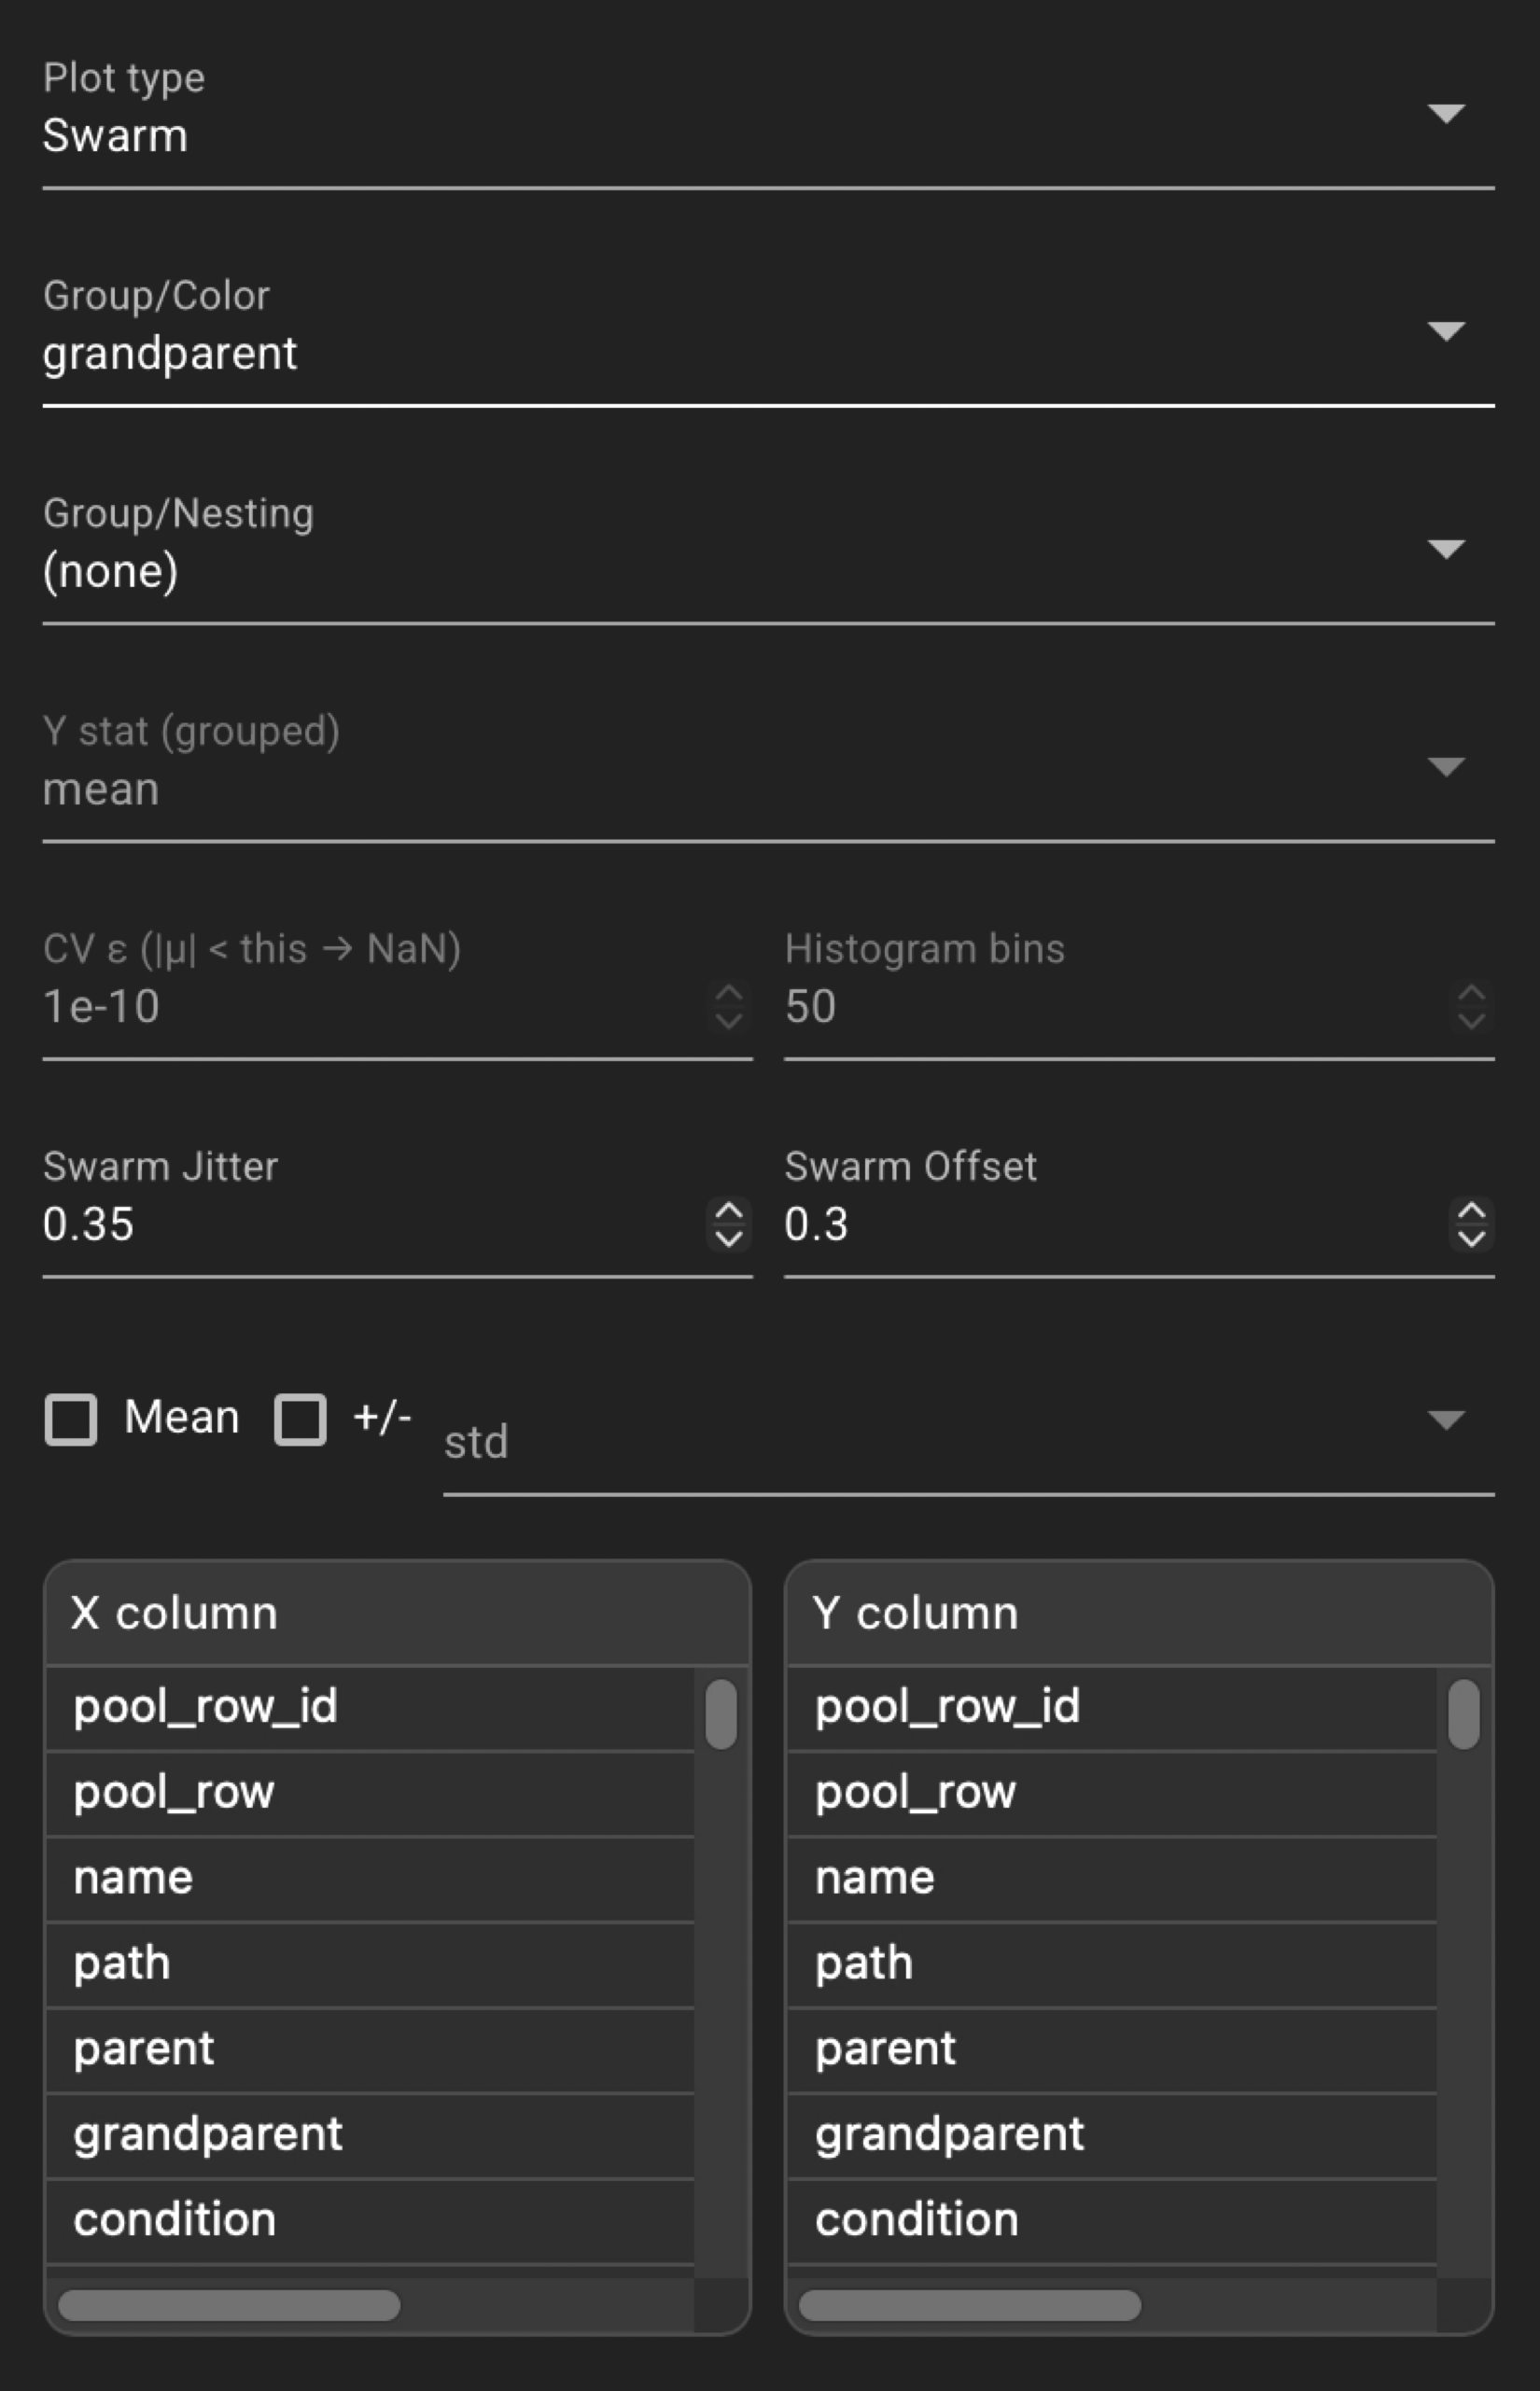
Left plot controls
The left column configures layout, plot type, filters, X/Y columns, grouping, and plot options. Screenshots below show the top and middle sections; a bottom-section screenshot will be added when available.
See also
- Using the GUI — Home page layout and Pool Plots header button
- Velocity analysis
- Peak detection
- Saved file formats