Peak detection
Peak detection measures normalized line intensity along a line scan kymograph ROI and detects transient peaks from a functional reporter (like GCaMP). The analysis computes delta-F over F0 (df/f0), applies derivative-threshold onset detection by default, and refines peak locations in a search window around each onset.
In the CloudScope GUI this workflow is labeled Peak Detect on the left toolbar.
Before you start
- Load a line scan kymograph (
.oir,.czi,.nd2,.tif, or.ome.zarr). - Select or create a rectangular ROI covering the region to analyze.
See Using the GUI for loading files and ROIs.
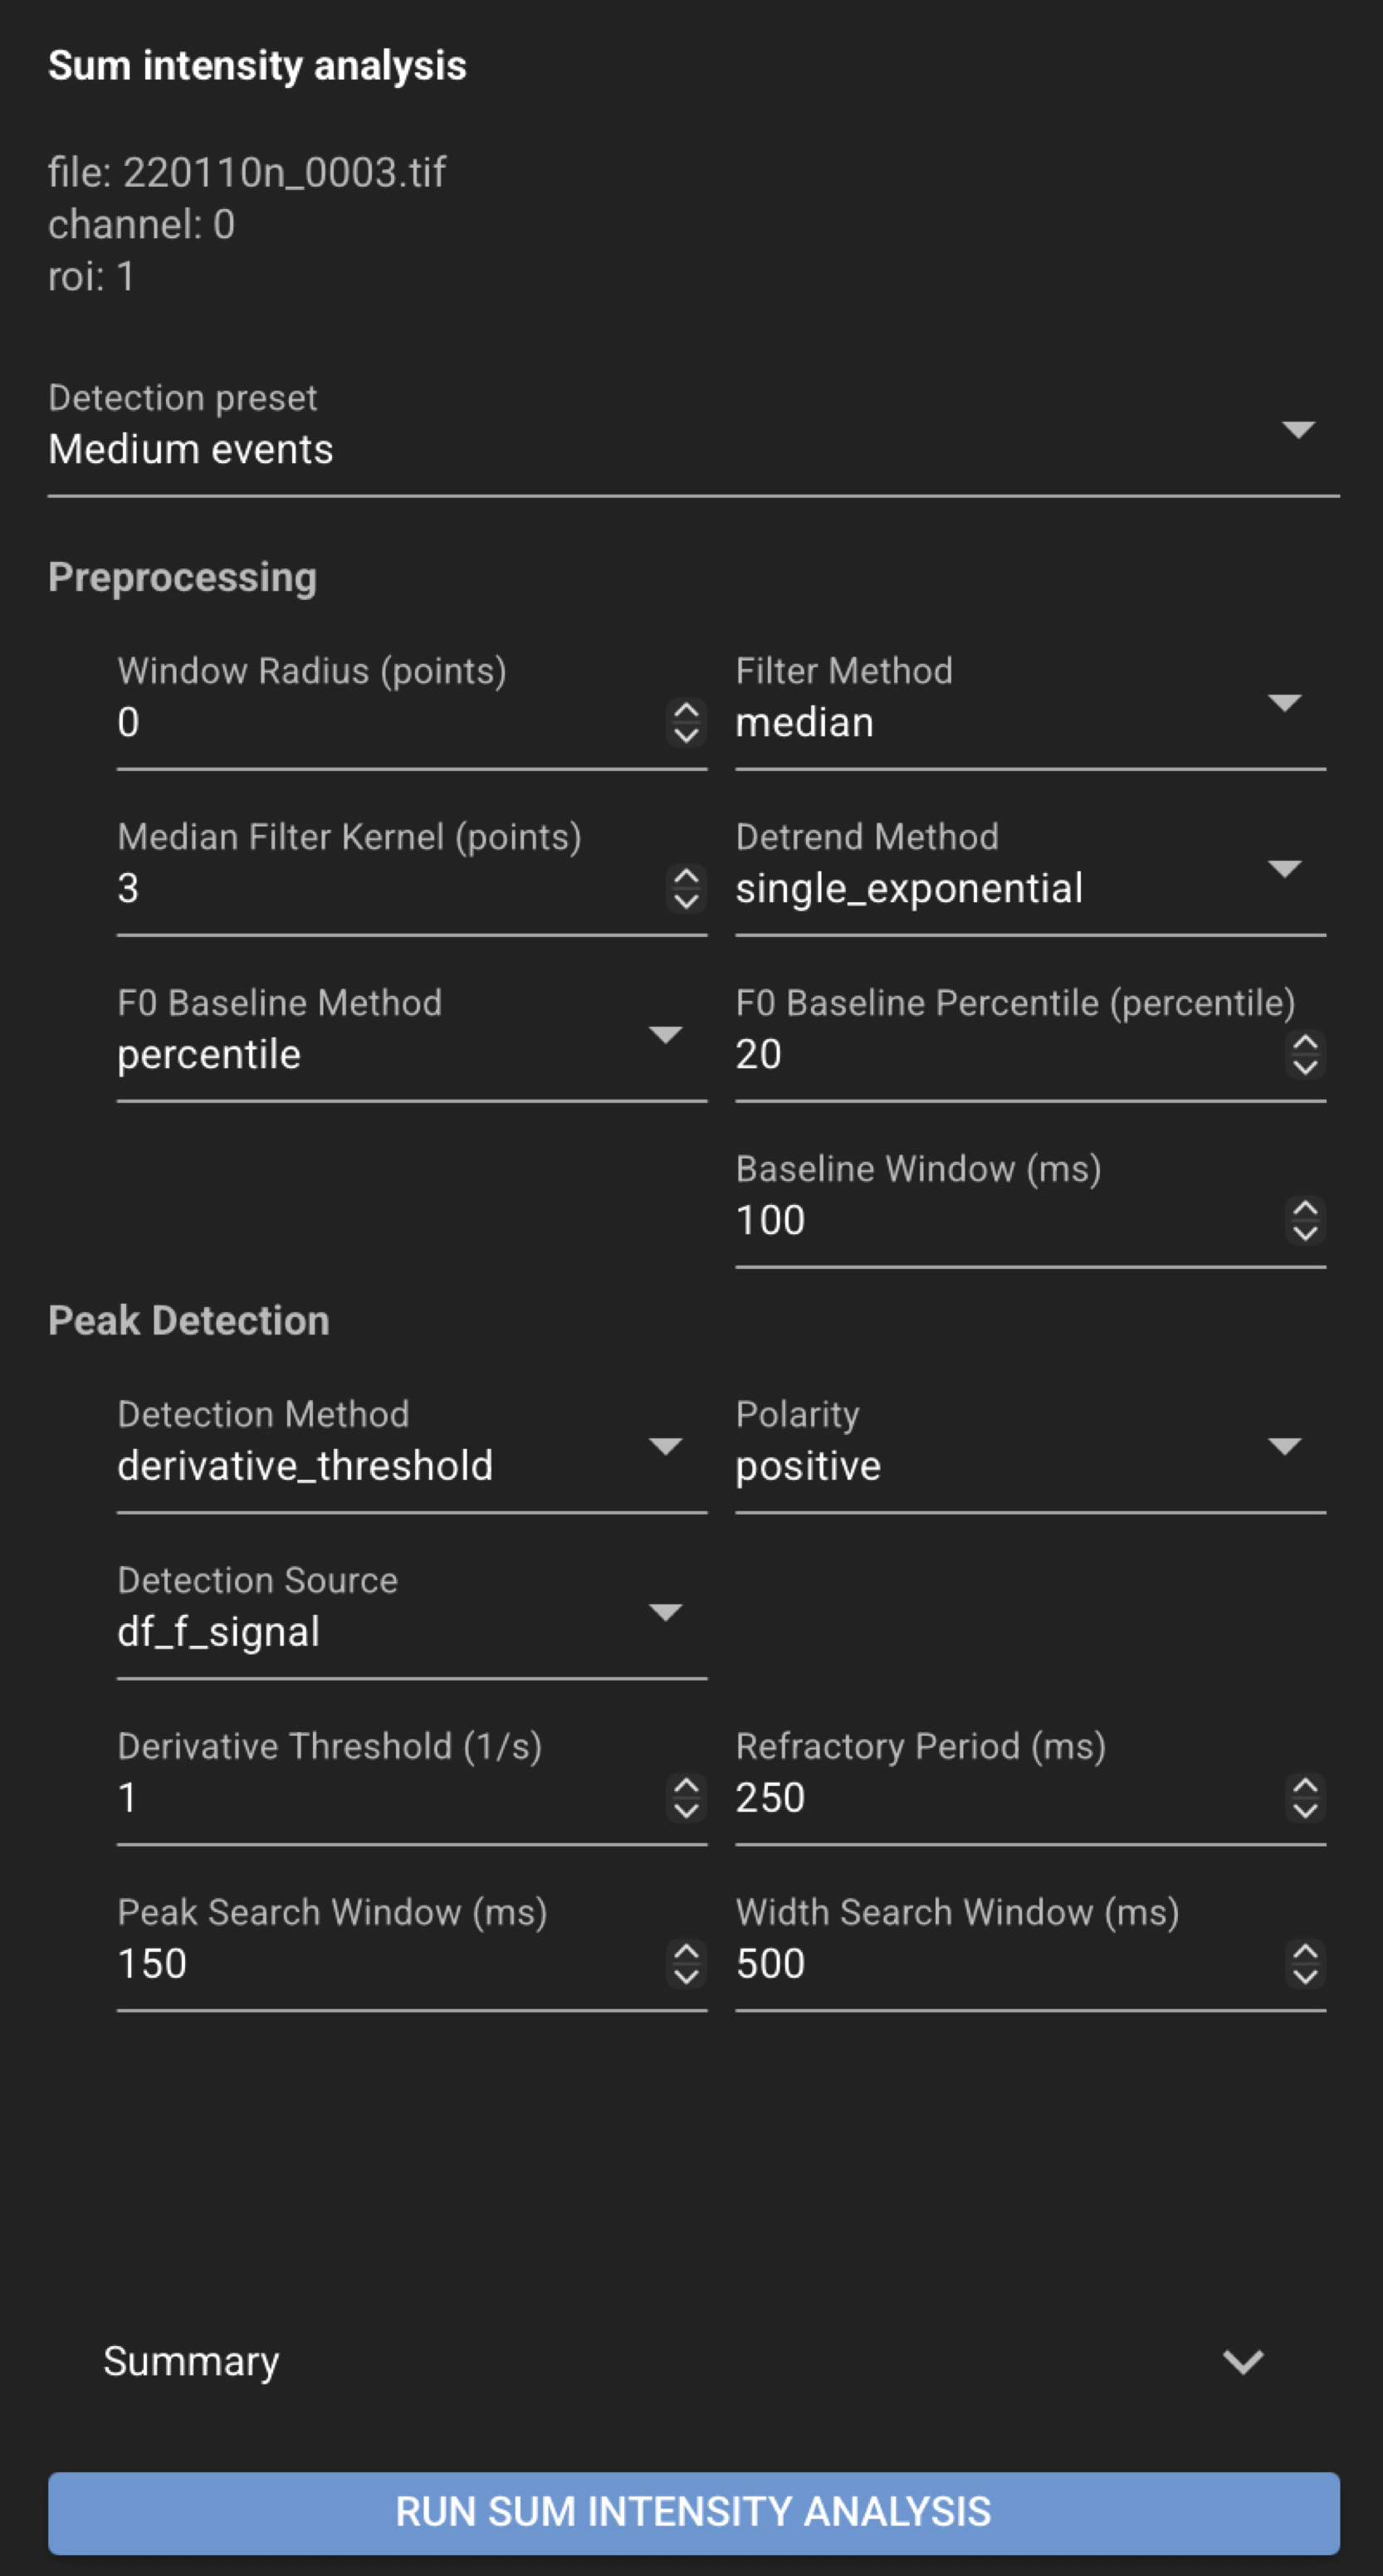
Run peak detection in the GUI
- Select the file, channel, and ROI in the file list.
- Open the left navigation toolbar and click Peak Detect (functions icon).
- Choose a Detection preset (fast, medium, or slow) or tune individual detection parameters.
- Click Run Sum Intensity Analysis.
- Review the plot: df/f0 trace, derivative, onset markers, and peak markers.
- Use Save Selected or Save All in the load/save controls to persist results.
Optional plot overlays (context menu on the peak-detection plot):
- Show or hide the derivative trace on the secondary y-axis.
- Show or hide a diameter trace when diameter analysis has been run on the same file, channel, and ROI (default off).
Edit F0 (baseline)
After a successful peak-detection run, you can adjust the F0 baseline from the peak-detection plot without leaving the Home page:
- Right-click the peak-detection plot and choose Edit F0.
- An Edit F0 toolbar and F0 plot appear above the df/f0 plot.
- Choose one of:
- Manual — drag the yellow Manual F0 horizontal line to the desired baseline, then click Set Manual F0.
- Percentile (auto) — set the baseline percentile in the toolbar, then click Set Auto F0.
- CloudScope re-runs peak detection with the new baseline and updates the plot.
- Click Close to leave Edit F0 mode without further changes (or leave after a Set).
Set Manual F0 stores baseline_method="manual" and the chosen manual_f0_baseline.
Set Auto F0 stores baseline_method="percentile" and the chosen baseline_percentile.
Save with Save Selected or Save All to persist the updated parameters and results.
Results
Review peak-detection results in the Peak Detect panel and the Peak detection plot at the bottom of the Home page. Save from the load/save controls to write JSON and CSV files next to the source image. See Saved file formats for output file details.
Saved files
For a source file named my_file.tif:
my_file.tif.json
my_file.tif.sum_intensity.csv
The JSON file stores detection parameters, summary values (for example peak count and F0 baseline), and event records. The CSV stores per-timepoint tabular traces and onset/peak markers.
See also
- Pool plots — compare peak results across the loaded folder
- End-user recipes
- Sum Intensity Analysis (Data Scientist) — detection parameters, presets, and science detail
- Sum Intensity Analysis Notebook — scripted workflow