Diameter analysis
Diameter analysis estimates vessel diameter from line scan kymographs.
Before you start
- Load a line scan kymograph.
- Select or create an ROI covering the vessel region to analyze.
See Using the GUI for loading files and ROIs.
Run diameter analysis in the GUI
- Select the file, channel, and ROI in the file list.
- Open the left navigation toolbar and click Diameter (straighten icon).
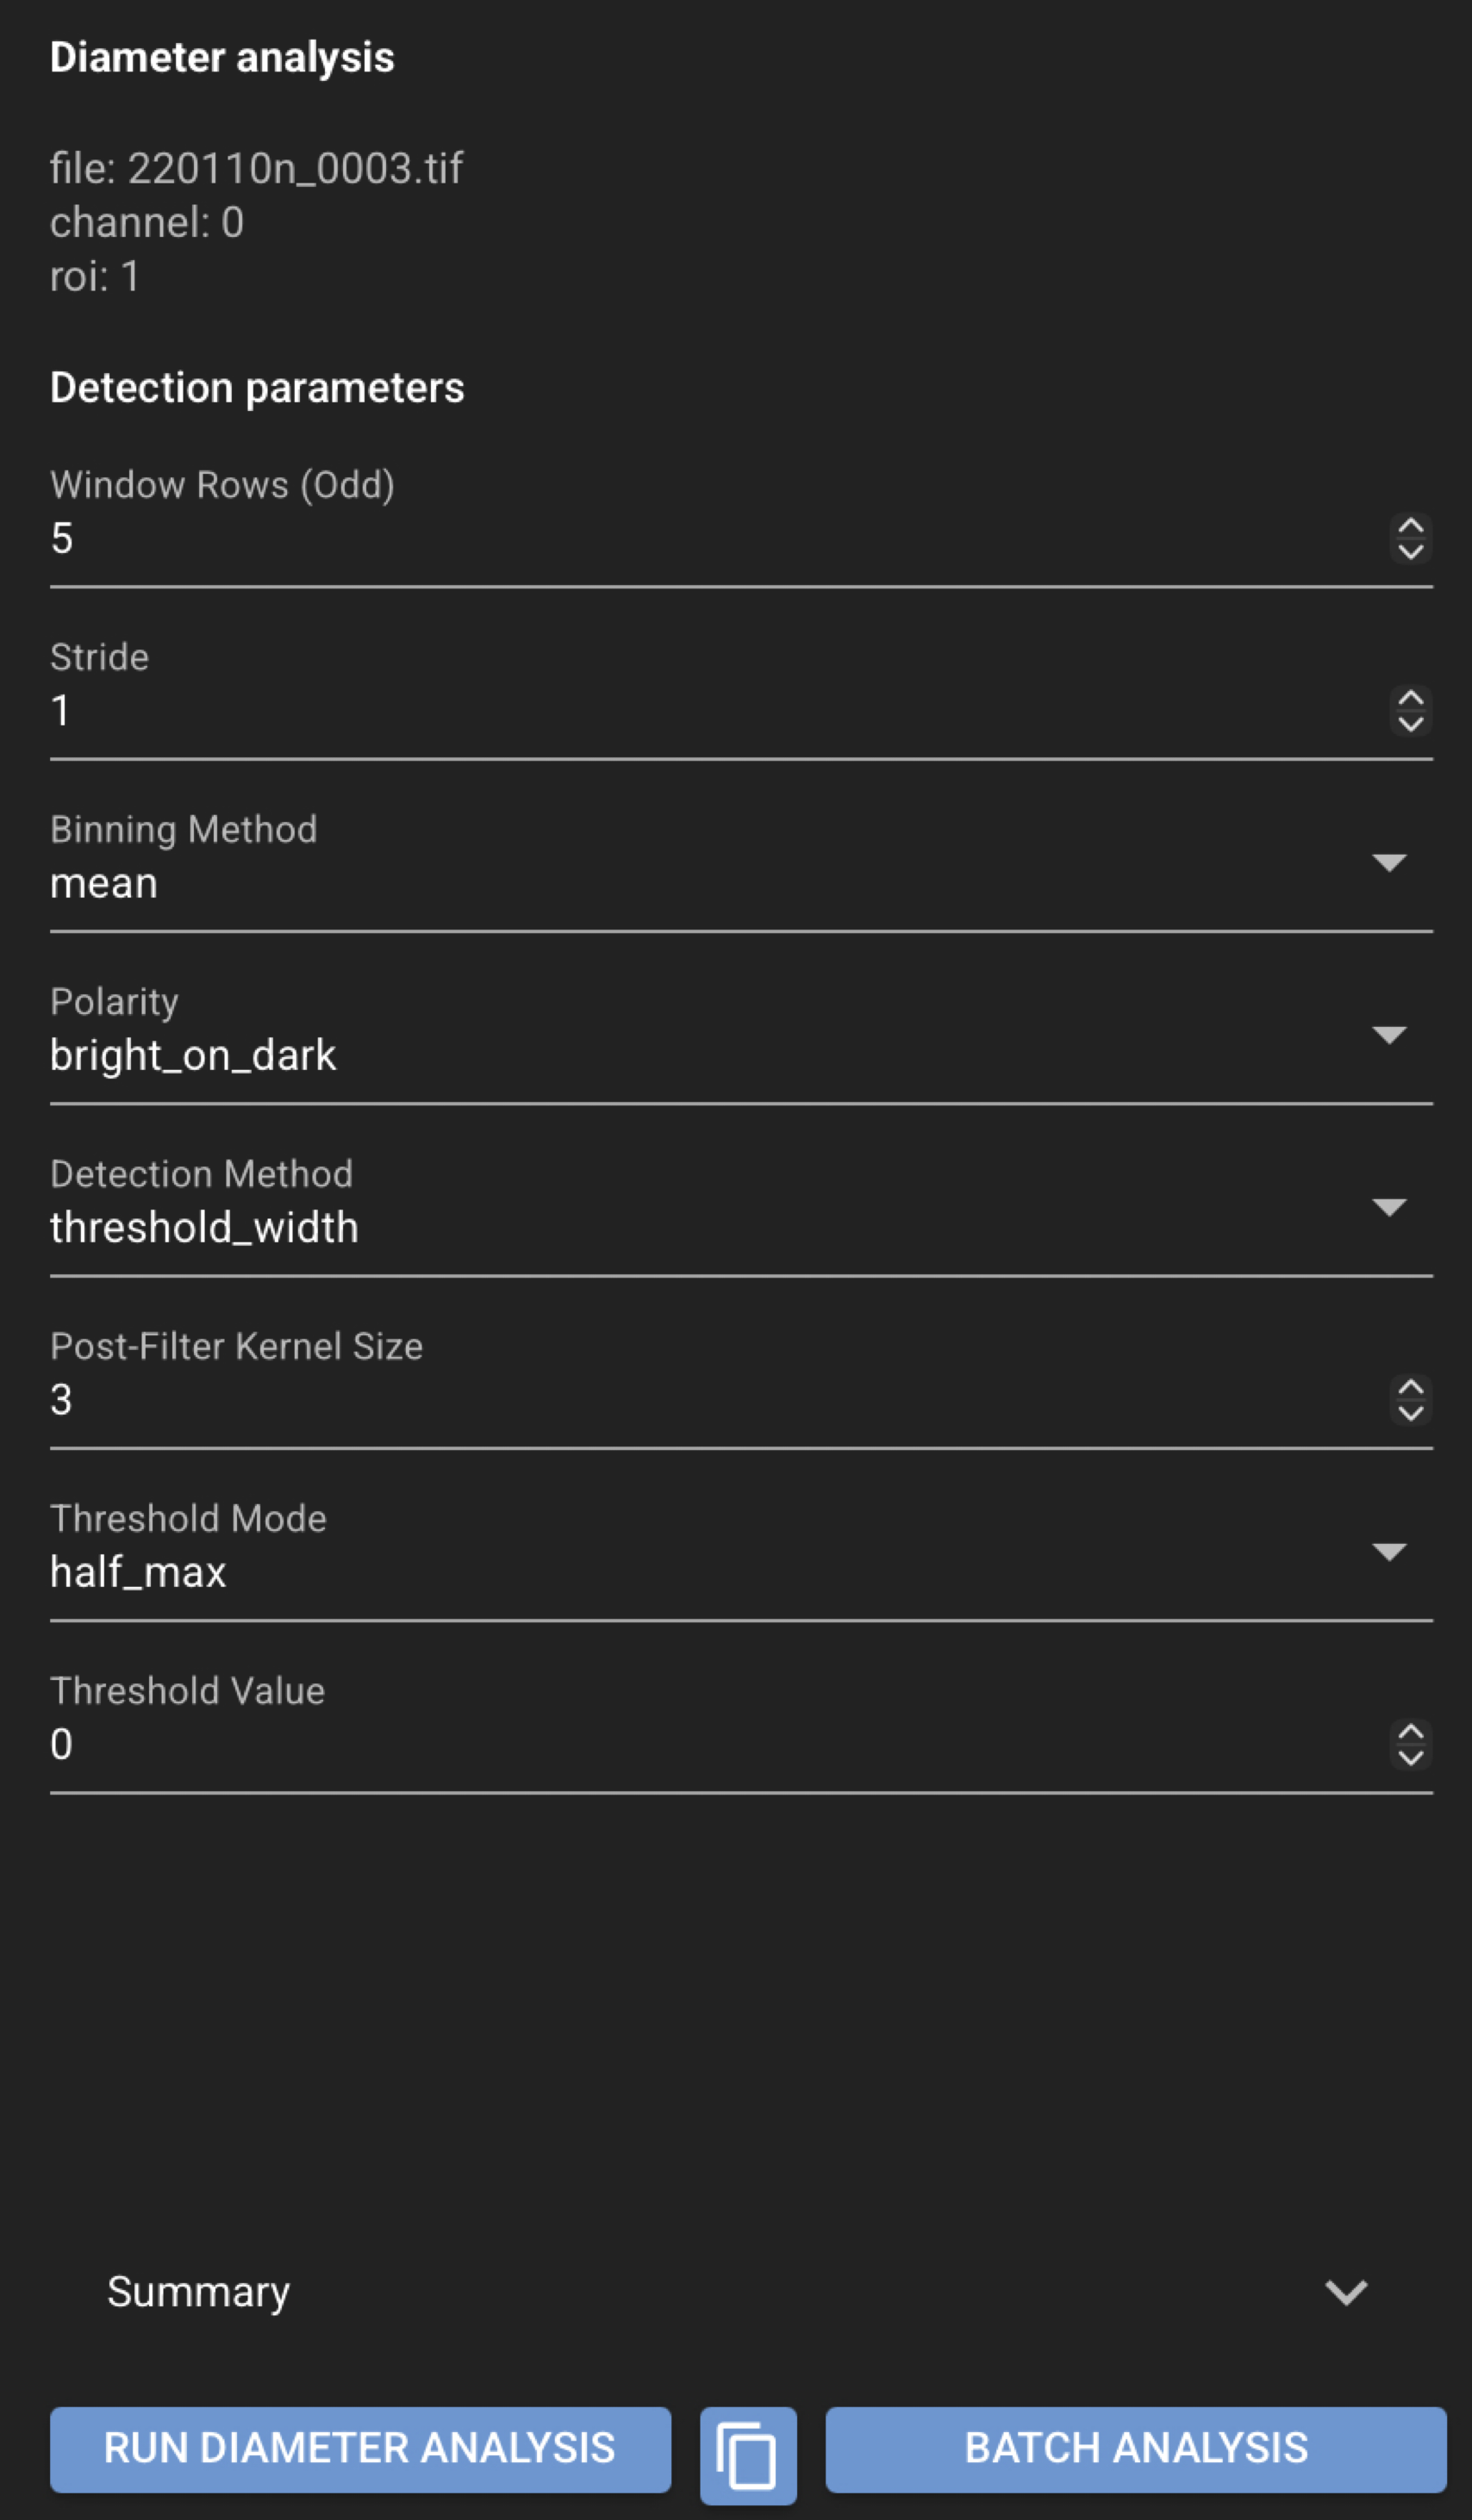
- Review Detection parameters in the Diameter panel.
- Run the analysis.
- Review the summary, quality-control values, and tabular output.
- Use Save Selected or Save All in the load/save controls to persist results.
Results and reproducibility
Review diameter results in the Diameter panel and the Analysis plot. Save from the load/save controls to write JSON and CSV files next to the source image. See Saved file formats for output file details.
Saved files
For a source file named my_file.tif:
my_file.tif.json
my_file.tif.diameter.csv
The JSON file stores detection parameters and summary values (for example mean diameter and QC scores). The CSV stores tabular diameter results.
See also
- End-user recipes
- Diameter Analysis (Data Scientist) — detection parameters and science detail