Velocity analysis
Velocity analysis estimates in vivo blood flow velocity from line scan kymographs using a Radon-transform-based method.
Before you start
- Load a line scan kymograph (
.oir,.czi,.nd2,.tif, or.ome.zarr). - Select or create an ROI covering the region to analyze.
See Using the GUI for loading files and ROIs.
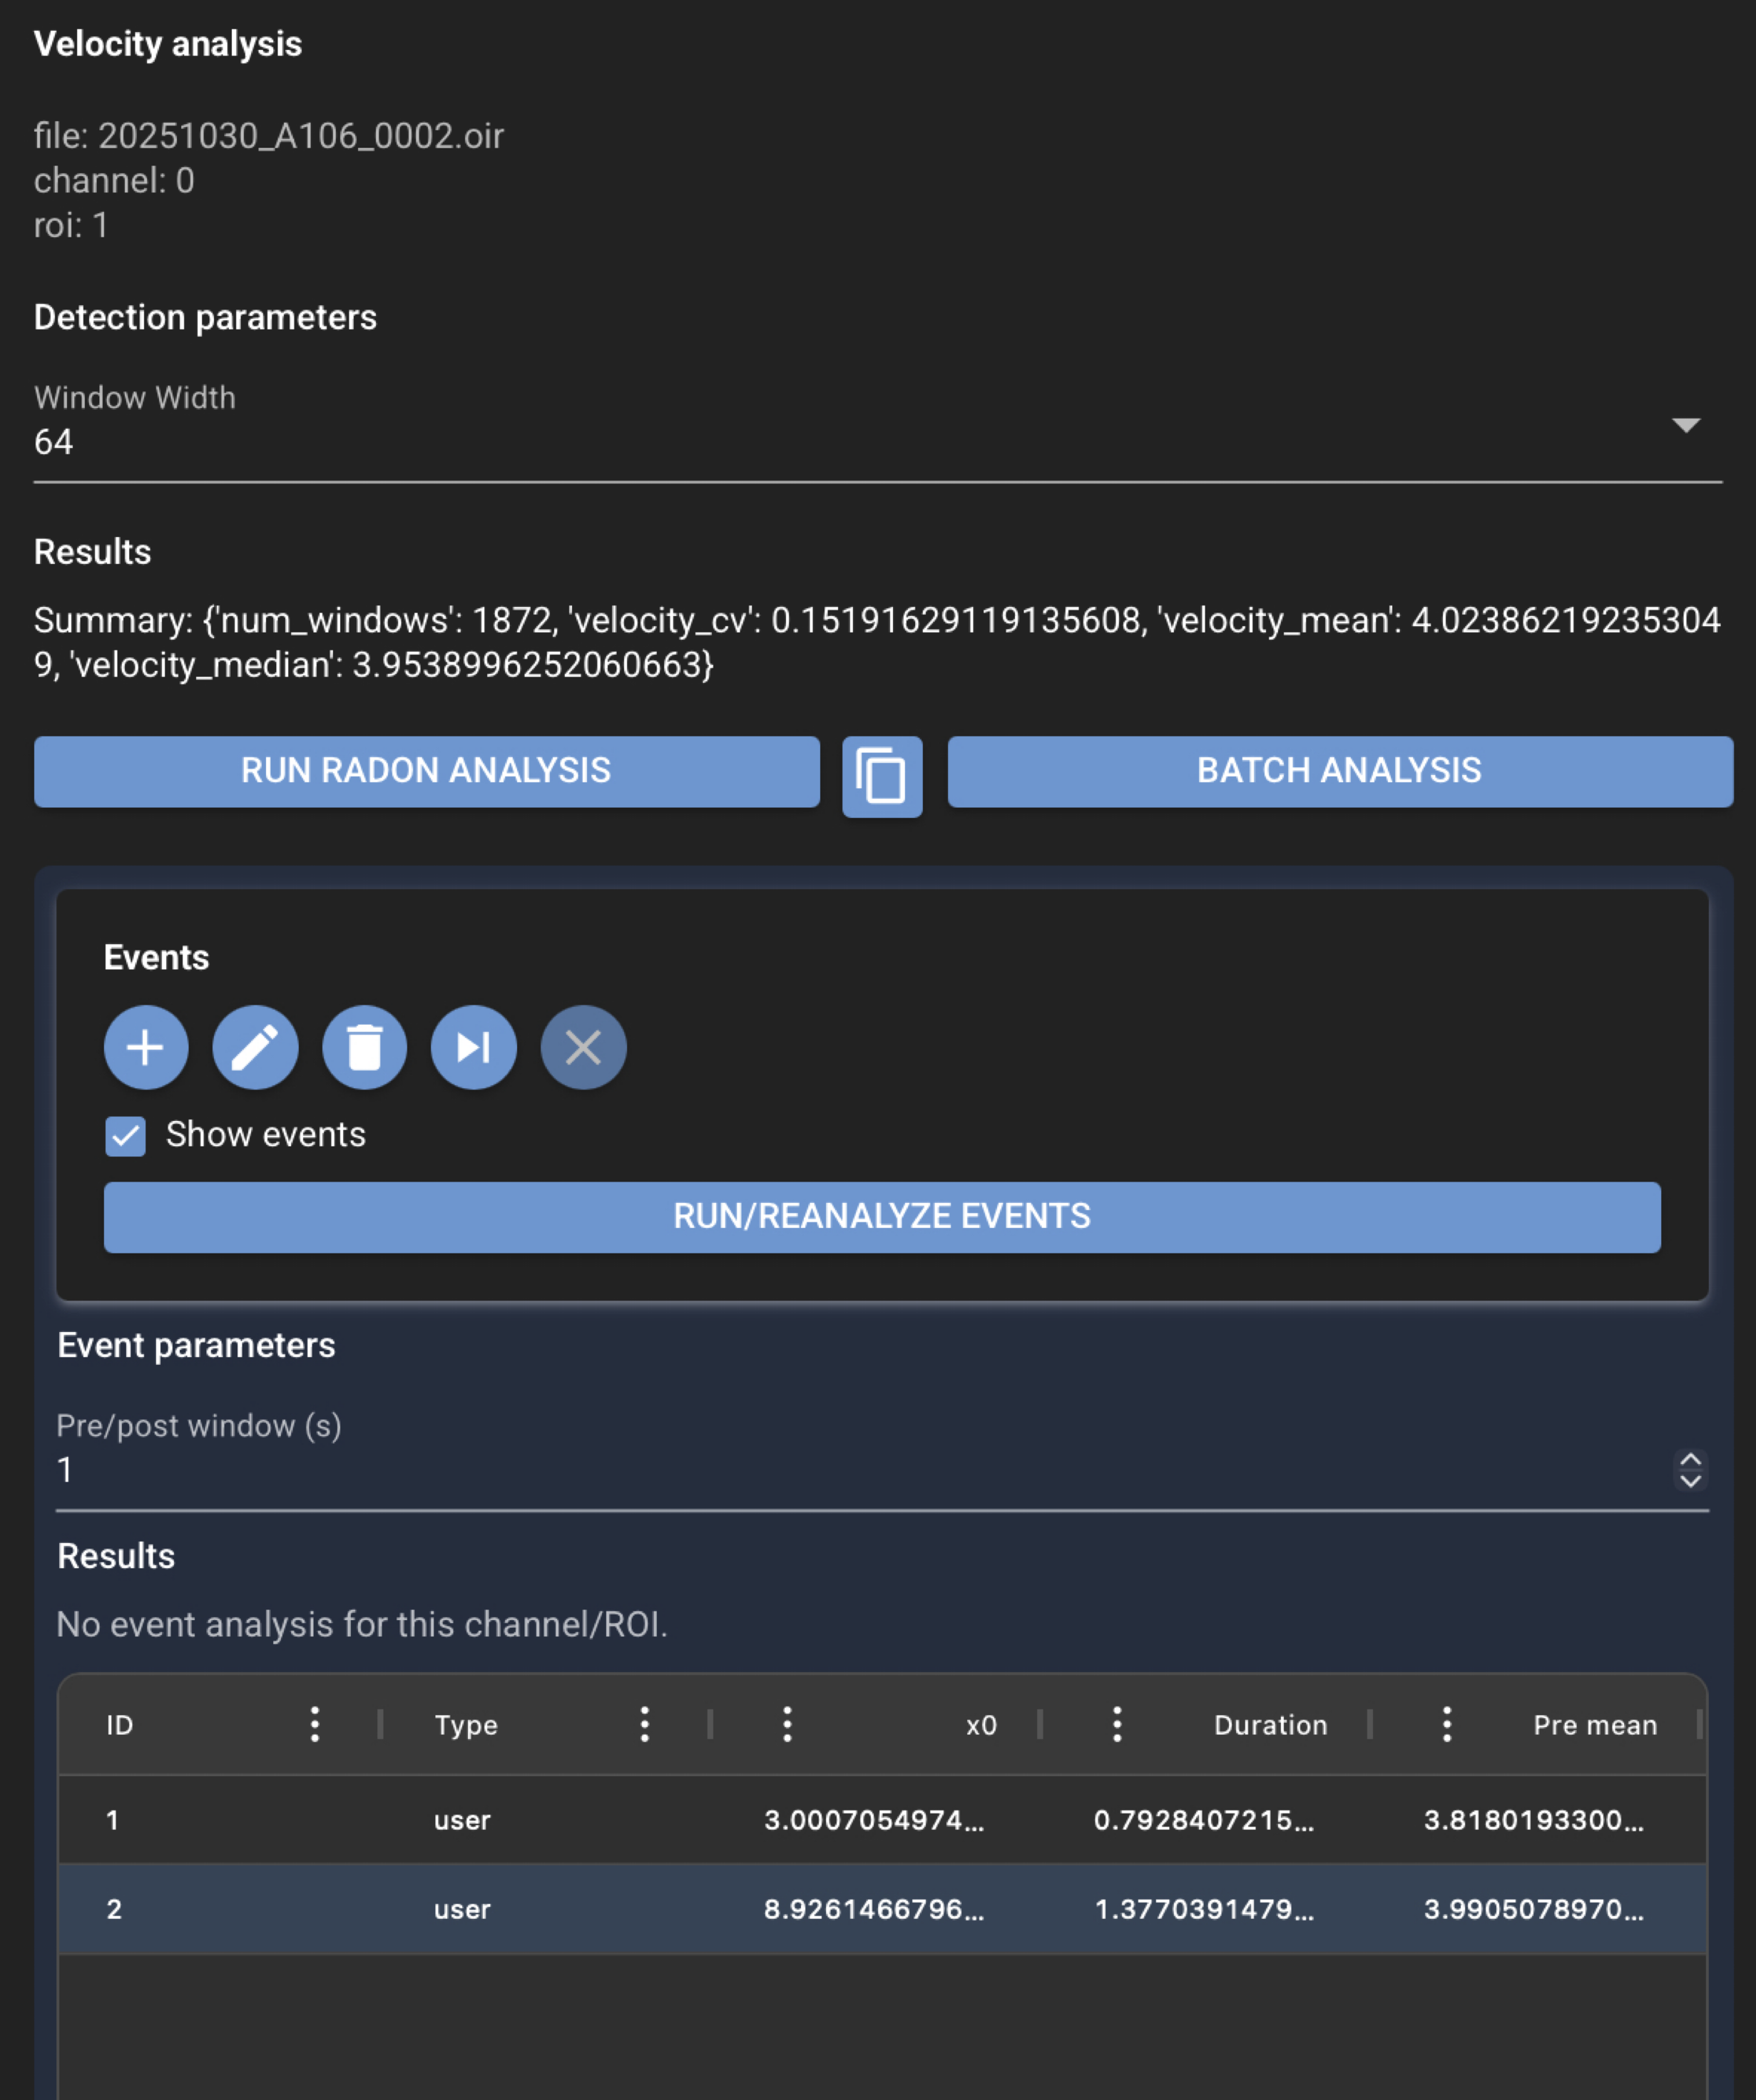
Run velocity analysis in the GUI
- Select the file, channel, and ROI in the file list.
- Open the left navigation toolbar and click Velocity (speed icon).
- Review Detection parameters in the Velocity panel.
- Click Run Radon Analysis.
- Review the results summary and plotted output.
- Use Save Selected or Save All in the load/save controls to keep results.
Optional: click Batch analysis to preview or run velocity analysis across multiple loaded files with shared ROI settings.
Results and reproducibility
Review velocity results in the Velocity panel, the Analysis plot, and the primary image viewer. Save from the load/save controls to write JSON and CSV files next to the source image. See Saved file formats for output file details.
Saved files
For a source file named my_file.tif:
my_file.tif.json
my_file.tif.radon_velocity.csv
The JSON file stores detection parameters and summary values. The CSV stores per-window tabular velocity results.
Next steps
- Pool plots — compare velocity results across the loaded folder
- Velocity event analysis — mark events on velocity results (same Velocity panel, scroll down)
- Analyses from velocity — heart rate and other derived workflows
- Velocity Analysis (Data Scientist) — detection parameters and science detail